How can we use the Gemini bot for trading? This question will be answered in the blog. AI chatbots like, Gemini and ChatGPT have been beneficial for analyzing stock charts and generating insights, their inability to access real-time data has been a significant limitation in trading. However, there is now a revolutionary AI tool that can overcome this challenge—Google’s Gemini. With real-time internet access, Gemini is the ultimate AI solution for traders looking to make data-driven decisions.

Getting Started with Google Gemini for Stock Trading
To start using Google Gemini for stock analysis, visit the site and sign up. The interface is similar to ChatGPT, but with the added advantage of real-time data access, making it a powerful tool for traders. Here’s a step-by-step guide on how to utilize Gemini for technical analysis and trading.
How to Analyze Stock Market Trends with Google Gemini
If you’re looking to analyze a specific stock or index like the Nifty 50, follow these steps:
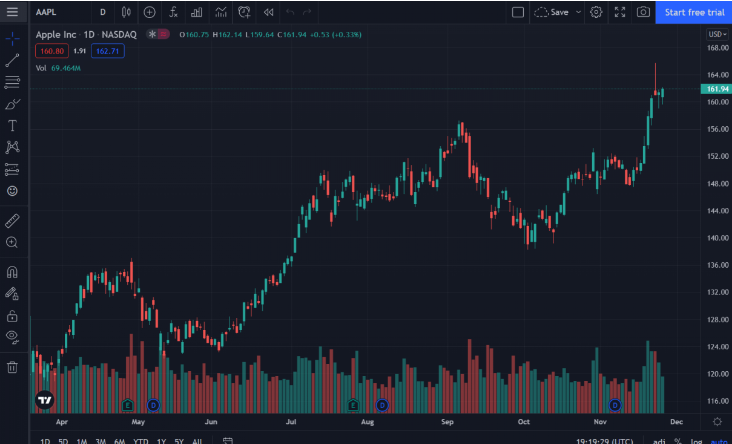
- Open TradingView: Search for “TradingView” and go to the website. Look up “Nifty 50” or any other stock of your choice.
- Select the Timeframe: Choose a 15-minute, 5-minute, or daily chart for more precise stock trend analysis.
- Download the Stock Chart: Take a snapshot of the stock chart and download it.
- Upload to Google Gemini: Go back to Gemini and upload the chart image. You can now ask questions like “What is the trend of this chart?” or “What are the support and resistance levels of this chart?”
For example, after uploading the Nifty chart, we asked Gemini about the support and resistance levels. It accurately identified them at 22,400 (resistance) and 22,200 (support).
Read more about Enhance Your Forex Trading Skills with AI: An Exploration of AI Tools for Trading Strategies.
Identify Support and Resistance Levels
You can also use the Gemini tool to identify support and resistance levels on the chart. For this, upload the screenshot of the chart again and ask a different question, such as “Identify the support and resistance levels.” Gemini will then analyze the chart and provide potential support and resistance levels.
For example, it might say:
- Support 1: (Value)
- Support 2: (Value)
- Support 3: (Value)
- Resistance 1: (Value)
- Resistance 2: (Value)
It will also mention the specific times when these levels were tested during the trading day.
Identifying Chart Patterns Using Google Gemini
For more detailed insights, such as identifying chart patterns or candlestick patterns, upload the chart again and ask Gemini, “Which chart pattern or candlestick pattern do you see in this chart?” Gemini provides precise answers. For example, it identified a Piercing Line candlestick pattern on February 27th and 28th, known as a bullish reversal pattern.
Performing Technical Analysis with Google Gemini
You can also request a technical analysis of a specific stock chart. For example, we uploaded the daily chart of Reliance Industries and asked Gemini to perform a technical analysis and recommend entry and exit points. While this can be a complex question, Gemini provides comprehensive answers by analyzing candlestick patterns, trends, support, and resistance levels. It also offers general advice, such as considering longer timeframes for more reliable investment decisions.
Using Google Gemini for Fundamental Analysis of Banking Stocks
Google Gemini is also useful for fundamental analysis of stocks, especially in sectors like banking. If you want to evaluate banking stocks, you can ask for ideal ratios like return on assets (ROA) above 1%, Net Interest Margin (NIM) between 2-4%, and Efficiency Ratio of 60%. With these ratios, you can filter the best stocks on stock screening platforms.
Checking Quarterly Results with Real-Time Data
Because Google Gemini has access to real-time stock market data, it can provide concise summaries of quarterly results. For example, if you want to check the quarterly performance of Polycab, simply search “Analyze quarterly results of Polycab,” and Gemini will provide the latest financial details.
Finding Real-Time Stock Price Targets from Brokerages
To get real-time stock price targets from different brokerage houses, you can ask Gemini directly. For instance, if you want to know Wipro’s stock price targets, ask, “Give me all the targets of stock Wipro according to brokerage houses.” Gemini will provide an average target, such as 450, based on the most recent data from various brokers.
Read more about Unlock AI Goldmines: 7 Proven Strategies to Make Money with Artificial Intelligence.
Discover Trending Stocks with Google Gemini
To identify trending stocks in the market, ask, “Which stock is trending in the news in the last 7 days?” Gemini will provide a list of stocks making headlines, such as Biocon and Pidilite Industries, along with any significant changes in their prices.
Identifying High-Growth Sectors for Future Investments
For long-term investors, Google Gemini can also predict which sectors will perform best over the next 10 years. For instance, it identified the healthcare sector (with a projected CAGR of 16-17% by 2024) and the AI sector (with a projected CAGR of 28% by 2030) as having significant growth opportunities. This information can help guide your investment strategy toward high-growth sectors.
Read more about AI Unveils Grok-2: Next-Gen Chatbots Revolutionize AI Image Generation on X.
Conclusion
Google’s Gemini offers a new dimension to stock trading by using real-time internet access for accurate, up-to-date information. While it excels in data-driven stock market analysis, it also requires a thoughtful approach to crafting trading strategies. Remember, successful stock trading involves not just using AI tools but also gaining knowledge, experience, and continuously learning about the stock market.